2025 Assessment Insights in Student Affairs
Note: The following is a guest post written by Dr. Joe Levy, Associate Vice Provost of Accreditation and Quality Improvement at Excelsior University, about Applying & Leading Assessment in Student Affairs — an open online course co-sponsored by Modern Campus.
While finances and enrollment changes have become mainstays of institutional concern, student learning assessment remains a top-cited area of concern and need for improvement for higher education institutions across accreditors. When assessment is cited, student affairs and co-curricular assessment activity (or lack thereof) is one of the top areas lacking among institutional practices.
An evergreen challenge is the lack of resources and knowledge around student affairs assessment. For these reasons and more, Student Affairs Assessment Leaders (SAAL) continue to invest in and promote their free massive open online course (MOOC), Applying & Leading Assessment in Student Affairs.
The course has run annually for the past nine years and consistently sees quality ratings of over 90%. Indication materials and activities have also had a positive impact on these ratings. It averages more than 1,600 participants per year and consistently brings in more folks due to the relevance of the material paired with the lack of resources and guidance available at institutions for faculty, staff and administrators on the subject. A free, self-paced introductory course with an abundance of resources and practical activities to ground the material has proven successful, popular and useful to thousands of people.
Each year, Joe Levy—who serves as the Open Course Manager for the SAAL Board of Directors—conducts analysis based on course participant results and feedback on the course experience. This serves as a great recap of the course experience for the year, and shows implications for changes that will influence the next iteration of the course.
This blog provides a summary of the data analysis and results from the 2025 open course that ran from February to March of 2025. The reporting resulted in a total of 88 pages, opening with an executive summary of six pages, followed by reports for the Welcome Survey/User Profile, Quiz Results, Assignment Rubric Results and User Experience/End of Course Survey Results. The executive summary PDF has bookmarks for these respective reports and summarized data disaggregation elements.
Key Takeaways: Enrollment
This year, we saw 1,677 participants enroll in the course, with 268 of them successfully completing the course. This resulted in a 16% completion rate, which is slightly lower than the 17.9% completion rate from 2024 but higher than the 14% and 15% completion rates from 2023 and 2022, respectively. 2025 holds the fifth highest completion rate in nine years of running the course. In addition to the competitive completion rate, this was our fourth highest enrollment in the history of the course!
Welcome Survey/User Profile
Participants are largely hearing about the course from friends of colleagues, SAAL/sponsors or instructors. They take the course because they enjoy learning about topics that interest them and hope to gain skills for a promotion or new career. While they have online experience from school or through various MOOC providers, course takers are relatively split between passive and active participants, who largely anticipate spending one to two hours per week on the course.
The majority of course takers spend 40% or less of their jobs on assessment and identify as intermediate or beginner with respect to their assessment competency. They hold all sorts of roles at institutions, with large concentrations of staff, managers/directors, administrators and student affairs assessment professionals. They work in functional areas across the institution, with the largest concentrations in student engagement and involvement, institutional effectiveness, and student conduct and care. They attend from all types of institutions, but the largest concentrations are in Public four-year over 10,000, Public four-year under 10,000 and Private four-year under 10,000. While we have course takers from all over the world, the vast majority are from North America, nearly half live in suburban residential communities, and most are native English speakers.
Course participants typically have master's degrees, while the next largest group has terminal degrees. The course welcomed participants of all ages (from 16 to 70), with an average reported age of 42 for all respondents and completers, and the most frequently reported ages being 40 for all respondents and 32 for completers. Course participants are majority female and the majority identify as women. While many races and ethnicities are represented, most participants identify as white, followed by Southeast Asian and East Asian.
Because course completers had a very similar demographic distribution/profile as the initial sample of survey respondents, the above narrative profile holds true for them, too. These results also largely mirror the results from last year, but you can read the Welcome Survey Results 2025 report to see more details and comparison information.
Quiz Results
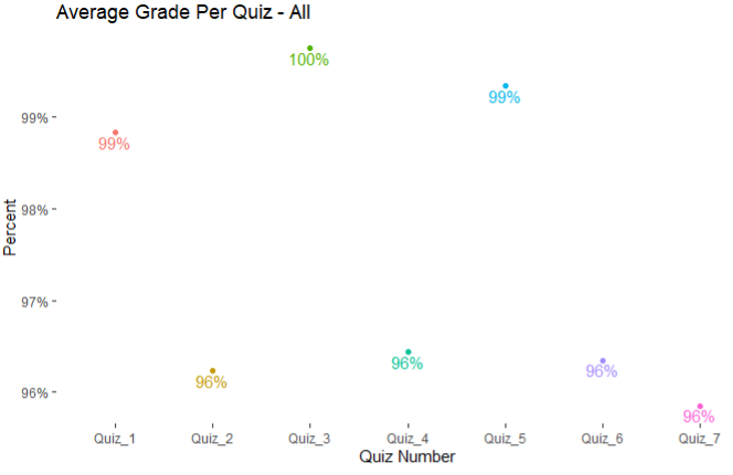
Overall, quiz results are very positive with respect to demonstrated student learning. The results below reflect all people who took quizzes. The mode quiz scores were the max values (100% correct score) per respective quiz, so average quiz scores are shown here to offer a bit more variability with respect to student performance in each quiz. Even with the averages, each quiz average is 96% correct or higher. These results are similar to 2024's results; this year's results were slightly higher for Quiz 1 and Quiz 3, while slightly lower for Quiz 7. (Last year's quiz scores in order: 98%, 96%, 98%, 97%, 99%, 96% and 97%).
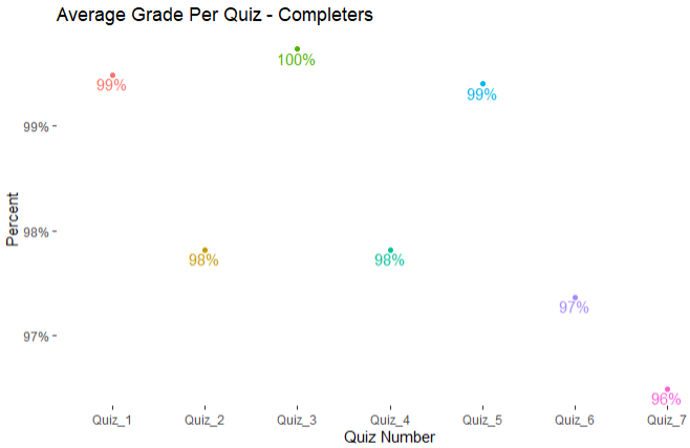
Course completer quiz results are the same (Quiz 1, Quiz 3, Quiz 5, Quiz 7) or slightly more positive than the overall quiz results for all participants (Quiz 2, Quiz 4, Quiz 6). Again, the mode quiz scores were the max values (100% correct score) per respective quiz, so average quiz scores are shown here to offer a bit more variability with respect to student performance in each quiz. Even with the averages, each quiz average is 96% correct or higher. These average scores were slightly lower (Quiz 1, Quiz 5, Quiz 7), slightly higher (Quiz 3), or the same compared to 2024's completer quiz data. (Last year's quiz scores in order: 100%, 98%, 99%, 98%, 100%, 97% and 97%.)
Data Disaggregation
Overall quiz results were disaggregated by completer demographics. As such, results were filtered from all course participants (1,677) to those who completed the course (268). Then, the results were further filtered to remove course participants who did not consent to their data being used for reporting purposes, bringing the sample down to 230. Finally, results per demographic question may have varied in sample size due to consenting course completers who may not have answered specific demographic questions or taken the Welcome Survey at all (where demographic data is gathered). A maximum possible sample size of 230 was based on completers who took the Welcome Survey.
Across quiz scores and demographics, groups did fairly well overall (which makes sense, considering all quiz scores averaged 96% or higher). Looking across a given demographic's scores (i.e., across all groups within a given demographic), the most participants with overall quiz scores of 95% or higher were inassessment competency (68%) followed by sex (62%) across all groups in each demographic (which is the same top two as 2024, just in reversed order). Overall, this kind of disaggregation helps surface where there may be gaps, issues or bright spots among and across specific populations. Future analyses could dig beyond these descriptives to truly examine relationships between variables. See more information about the individual quiz question scores and demographic breakdowns in the Quiz Results 2025 report.
Assignment Results
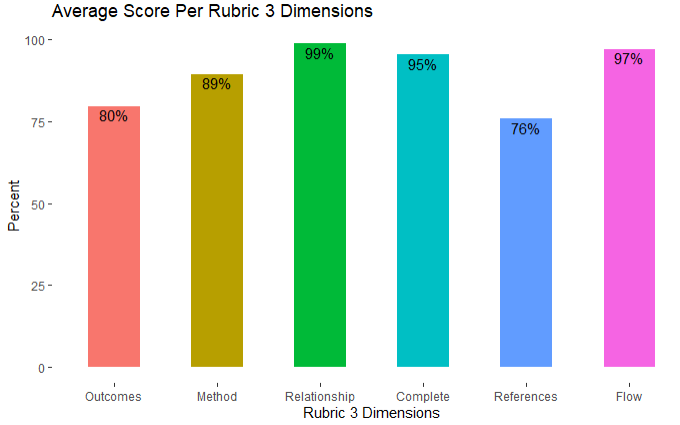
Overall, participants did pretty well on assignments. Participants needed a score of 75% or better on each assignment to count toward earning the course badge. The Module 3 assignment mode score was 28 out of 30 overall, with the following mode scores per rubric dimensions: Outcomes 5/5, Method 5/5, Relationship 5/5, Complete 5/5, References 3/5 and Flow 5/5. In 2024, the overall mode score was 28 and the scores per rubric dimension results were all 5/5. To add a bit more detail to the results, the average scores per rubric dimension are presented below as percentages of total possible (100%) correct.
The mode score for the Module 5 assignment was 25 out of 25 overall, with the following mode scores per rubric dimension: Connection 5/5, Critical lens 5/5, Complete 5/5, References 5/5 and Flow 5/5. In 2024, the results were exactly the same. To add a bit more detail to the results, the average scores per rubric dimension are presented below as percentages of total possible (100%) correct.
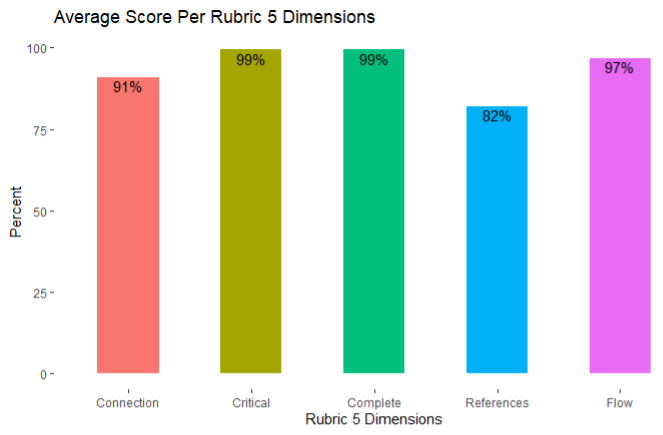
It is worth mentioning that these data were not filtered for course completers. Aside from people who did not want their data to be used for analysis purposes, these data reflect all submitted assignments by course participants. The next section of the report gets into more detailed performances of participants per assignment rubric.
Data Disaggregation
To analyze the results, responses were filtered by participants who consented to using their data for assessment or report-related purposes only. This resulted in a sample of 280 participant artifacts for the Module 3 assignment and 259 participant artifacts for the Module 5 assignment. It is worth noting that these resulting samples of 280 and 259 differ from overall amounts of assignments graded (322 for Module 3 and 297 for Module 5) since not all participants consented to their data being used for reporting purposes. Moreover, these sample amounts differ from overall course completers (268) since successful course completion requires scoring 75% or better on each quiz and on each written assignment, which not all of these assignments may represent.
Across rubric scores and demographics, groups did fairly well overall (which makes sense, considering the mode score for Module 3 was 28/30 and Module 5 was 25/25). Overall results were relatively similar to 2024's data: four of six rubric dimensions for Module 3 were the same or better and two of five for Module 5 were the same or better. Across self-reported assessment competency, sex, gender and race/ethnicity populations, 67-91% of folks across groups earned an 87% or better on Module 3 and 60-93% of folks across groups earned a 92% or better on Module 5. For more detail and data on the demographic disaggregation or the assignment performance data, check out the Rubric Results 2025 report.
User Experience Survey/End of Course Evaluation Results
End of course evaluation occurs by way of a user experience survey offered to all participants. An initial sample of 269 respondents was filtered by participants who consented to using their data for assessment or report-related purposes only. For comparison purposes with other course data sets, respondents were further filtered by participants who successfully completed the course and earned the course badge. This resulted in a sample of 255 responses.
- 94% of respondents agreed or strongly agreed to the positive impact of course materials (videos, lecture material, readings). These results are a little higher than 2024 (93%).
- 96% for course activities (quizzes, assignments, discussion boards). These results are higher than 2024 (92%).
- 61% of respondents indicated they spent two hours or less on the course (down from 66% in 2024), with another 25% (86% total) spending three to four hours per week (same as 2024).
- 51% of respondents indicated the likelihood of recommending the course as a nine or 10 (down from 55% in 2024), with another 24% (75% total) responding with an eight (same as 2024).
- 92% of respondents rated course quality as four or five out of five stars. This year's results are slightly higher than 2024's result of 91% responding with four or five stars.
- 56% of respondents indicated instructor involvement should be a variety (up from 55% in 2024), while 33% indicated they like to learn on their own (up from 30% in 2024). Peer to peer learning decreased to 5% from 8% in 2024, interacting only with instructor to 4% from 6% in 2024, and no instructor interaction is the same as it was in 2024 at 1%.
- 50% of respondents indicated a course length preference of seven to eight weeks (49% in 2024), 31% indicated a preference of five to six weeks (up from 28% in 2024).
Data Disaggregation
Given the disaggregated results shared, future analyses could dig beyond these descriptives to truly examine relationships between variables. This would especially be worthwhile with respect to hours spent per week on Online Learner Type, Non-Native English speakers, Education Level and Race/Ethnicity variables, as these areas seemed to have higher amounts of students spending two hours or less on the course this year compared to 2024, when this year's overall results showed more students spending more time on the course per week. Likewise, Online Learner Type and Age variables showed increases across group percentages of overall course rating, which are in line with overall increases this year compared to 2024, whereas other variables had decreases or more result variability from year to year. To see more of these demographic results or survey results overall, check out the User Experience Survey Results 2025 report.
Qualitative Analyses
When looking at the user experience survey, there were two open-ended questions. The first was focused on professional and personal goals and contained feedback that was mostly positive (68% of comments had a positive sentiment). With respect to negative or constructive feedback:
- a few participants noted limitations in their ability to engage fully due to time constraints;
- some expressed that while the course reinforced existing knowledge, it offered limited new insights for those with advanced backgrounds in assessment;
- others suggested that earlier access to the course or more flexible pacing could have improved their experience; and
- a small number of comments reflected feelings of imposter syndrome or uncertainty about applying assessment concepts, indicating a need for more foundational support or scaffolding.
The second open-ended question captured general feedback about the course and saw participants provide more direct suggestions for improvement. Common themes included:
- a desire for extended course duration (e.g., full semester format), more engaging and detailed lecture content and better organization of reading materials;
- notes on technical issues such as poor contrast in dark mode and overwhelming reading volume;
- several respondents recommended refining assignments to better align with personal professional contexts and increasing peer-to-peer engagement; and
- suggestions on adding more real-world case studies and improving the interactivity of video content.
Though some of the comments were more about the individual than the facilitation of the course, it is all good feedback for the instructors to consider for possible improvements to the course and/or to adjust our approach when engaging with students.
This past year saw two new instructors teaching the course for the first time. Naturally, they will have elements of their approach and content to tweak in preparation for 2026. As always, the instructor team is eager to use this information as direction, guidance and direct feedback for what is working well, what to improve and what participants are looking for with respect to their experience in the course. The course instructors take these data very seriously and work to reflect the participant voice in the many improvements and enhancements made to the course.
Thank You
We would be remiss if we did not express our gratitude for the co-sponsors of the 2025 course, of which Modern Campus remains a continued and generous partner. For anyone who wants the latest course information or to stay abreast of the next course iteration, please visit SAAL's open course webpage.
Conclusion
The course’s primary purpose has always been to serve as a resource to support professionals interested in learning more about assessment for student affairs and co-curricular areas. As such, while we enjoy a great completion rate for a MOOC, we are quick to encourage anyone and everyone to sign up for the course in order to gain (and retain) access to the course and its materials. We are pleased, too, that the course continues to be a popular and positive experience for participants.
While we are always eager for people to spread the word and join our next course run—an historic 10th edition is coming early 2026—we care most that people find the course materials useful and it is helping improve their practice. It is great when we hear the success stories and ways in which the course has helped people. For all those stories we don’t hear about, we hope the course is helping move the needle and encouraging people to better engage their institution in the work and, most importantly, collaborate across campus to create the best environment for student learning. In today’s higher education environment, data-informed decision making on continuous quality improvement is everyone’s responsibility. We hope the course can continue to play even a minor role in assisting people in those efforts to best support student learning and success.
.
Last updated: October 21, 2025
