See Trends and Opportunities More Clearly
Powered by Tableau, Lifelong Learning Extended Education Dashboards allow higher education leaders to see trends and operate their business with data-driven intelligence.
Make Sense of Your Data
Higher education institutions are always gathering data but often suffer from data overload. Dashboards simplify your data and make analysis a cinch.
Visualization From the Start
With over 40 dashboards available out-of-the-box you can start analyzing data right away. Staff can also build new dashboards or add additional data sets.
Insights From Multiple Angles
Gain insights into curriculum and offerings, enrollments, financials, applications, student and group outcomes, instructors and facilities.
Make Data-Backed Programming Decisions
With messy data, many institutional leaders are forced to make key decisions around which programs and courses to offer, when to offer them, and how many sections of each—based on gut feeling. With powerful enrollment-focused data visualizations, Lifelong Learning Extended Education dashboards let higher education leaders understand enrollment trends for each offering individually as well as how they fit into the whole.
For Example
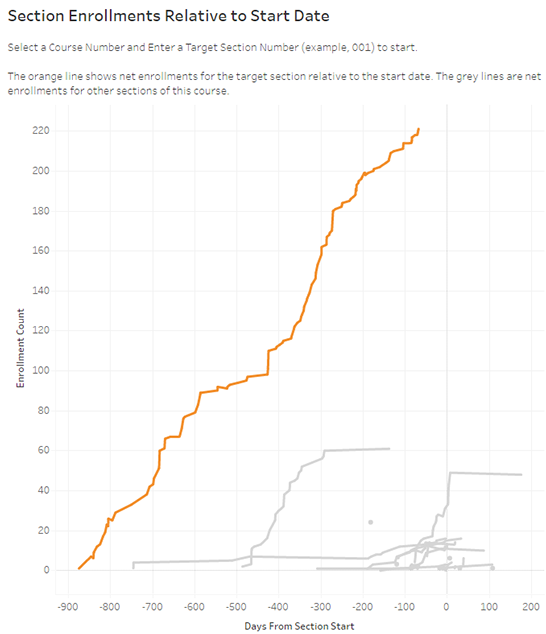
This enrollment dashboard shows the net enrollment count for a single course section over time with a comparison to other historical sections of the same course. Staff can filter what data is displayed and can drill into any specific data points so that they can determine how and when to market the course to how to allocate space, from whether it should be cancelled for low enrollment to whether more sections are needed, and much more.

Lifelong Learning Extended Education gives all staff—be they managers or curriculum development support personnel—more data and evidence on which to base their decisions, practices and programming.
Understand customer tendencies
Give staff both a high-level and granular view of how each learner engages with the institution so that they can effectively manage broad campaigns and individual interactions.
Explore the top 10 dashboards you need to run your division better
Visualize Geographic Distribution
Map registrant addresses by course section, certificate, program and even conference. At a glance you can know where your enrollees are coming from, which makes a huge difference when it comes to marketing efforts and determining offering locations.
Predict Busy Periods
Quickly see dates with relatively high or low enrollment counts to identify patterns in which times of the year—and even which days of the week—tend to have high enrollment volumes. Use color-coded heat map analysis and make staffing decisions, set application open dates, define and assess marketing strategy and make other key management choices.
Visualize Individual Interactions
Easily see the purchasing activities of individual students or groups over time. Whether you’re answering a student inquiry or managing a high-profile group, you know at a glance the activity history for each of your customers.
Own Your Financials
Non-traditional divisions tend to have a responsibility to, at minimum, be cost-recovery and ideally generate revenue for the institution. Unfortunately, data on financial performance and impact can often be hard to generate and share—especially in real time.
With Lifelong Learning Extended Education Dashboards, higher education leaders can get a quick overview of which courses, programs or offerings tend to generate the most income for the division and, more broadly, what kinds of offerings are responsible for what proportion of your divisional revenue.
When people ask me, 'How many of your students are in online courses?' and, 'How many of your students are taking courses at this campus or this campus?' I have access to reporting tools that give me those answers. That’s a very important way of using tools to report accurately and effectively.
Efficient Scaling at the University of Guelph
Learn how Lifelong Learning Extended Education (formerly Destiny One) is helping to foster growth for University of Guelph OpenEd by providing insightful reports and improving their student and staff experiences.
Explore more Lifelong Learning Extended Education modules