Note: The following is a guest post written by Dr. Joe Levy, Associate Vice Provost of Accreditation and Quality Improvement at Excelsior University, about Applying & Leading Assessment in Student Affairs — an open online course co-sponsored by Modern Campus.
Assessment of student learning remains one of the most cited areas of concern or need for improvement for higher education institutions across accreditors. Within that space, assessment for student affairs and co-curricular areas is one of the top areas lacking among institutional practices.
Seemingly an evergreen challenge is the lack of resources and knowledge of student affairs assessment. For these reasons and more, the Student Affairs Assessment Leaders (SAAL) continue to invest and promote their free massive open online course (MOOC), Applying & Leading Assessment in Student Affairs.
The course has run once a year for the past eight years and consistently sees over 90% course quality ratings. Indication materials and activities also had a positive impact on them. It averages more than 1,500 participants per year and consistently brings in more folks due to the relevance of the material paired with the lack of resources and guidance available at institutions for faculty, staff and administrators on the subject. A free, self-paced, introductory course with an abundance of resources and practical activities to ground the material has proven successfully popular and useful to thousands of people.
Each year, Joe Levy – who serves as the Open Course Manager for the SAAL Board of Directors – conducts analysis from course participant results and feedback on the course experience. This serves as a great recap of the course experience for the year, as well as implications for changes to influence the next iteration of the course.
This blog provides a summary of the data analysis and results from the 2024 open course that ran from February to April of 2024. The reporting resulted in 96 total pages, opening with an executive summary just over six pages, followed by reports for the Welcome Survey/User Profile, Quiz Results, Assignment Rubric Results and User Experience/End of Course Survey Results. The executive summary has hyperlinks to these respective reports and data disaggregation elements summarized.
Key Takeaways: Enrollment
This year, we saw 1958 participants enroll in the course, with 350 of them successfully completing the course. This resulted in a 17.875% completion rate. This rate exceeds the 14.4% completion rate from last year and the 15% completion rates from 2021 and 2022. It’s actually the fourth highest completion rate in the eight years running the course! In addition to the higher completion rate, we saw over 400 more participants sign up this year compared to last; our third highest enrollment in the history of the course!
Welcome Survey/User Profile
Participants are largely hearing about the course from friends of colleagues, from SAAL/sponsors or from the instructor. They take the course because they enjoy learning about topics that interest them and hope to gain skills for a promotion or new career. While they have online experience from school or through various MOOC providers, course takers are relatively split on being passive or active participants for this course and they anticipate spending 1-2 hours per week on the course.
Majority of course takers have 40% or less of their jobs dedicated to assessment and identify as intermediate or beginners with respect to their assessment competency. They hold various roles at institutions, with large concentrations as staff, managers/directors, administrators and faculty. They work in functional areas across the institution, with large concentrations in institutional effectiveness, career and academic advising, auxiliary and administrative services, along with student engagement and involvement. They attend from all types of institutions but the largest concentrations are in public 4-year over 10,000, private 4-year under 10,000 and community college under 10,000. While we have course takers from all over the world, the vast majority are from North America, nearly half in suburban residential communities and the vast majority of participants speak English as their native language.
Course participants typically have master’s degrees, the next largest group has terminal degrees. The course welcomed all ages of participants (from 19 to 74), with the average reported age of 46 for all respondents and 45 for completers, with the most frequently reported ages being 42 for all respondents and 29 for completers. Course participants are majority female and the majority identify as women. While many races and ethnicities are represented, the majority of participants identified as White, followed by African-American/Black and Hispanic/Latinx.
Since course completers had a very similar demographic distribution/profile as the initial sample of survey respondents, the above narrative profile holds true for them, too. These results also largely mirror the results from last year. Details and comparison information can be found in the Welcome Survey Results 2024 section of the report.
Quiz Results
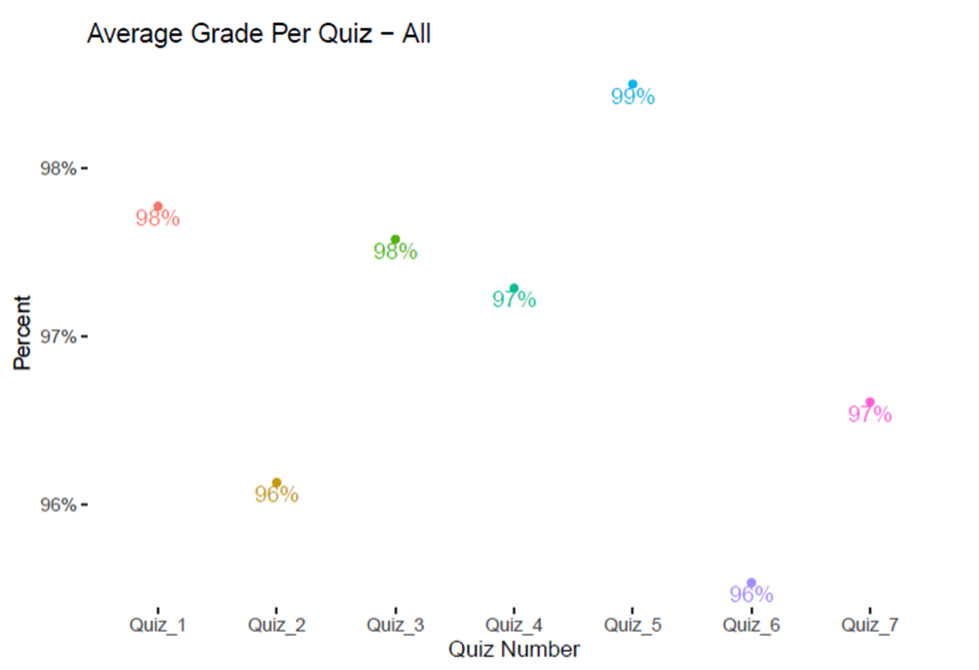
Overall, quiz results are very positive with respect to demonstrating student learning. The results above reflect all people who took quizzes. The mode quiz scores were the max values (100% correct score) per respective quiz, so average quiz scores are shown here to offer a bit more variability with respect to student performance in each quiz. Even with the averages, each quiz average is 95% correct or higher (up from 93% last year). These results are very similar and only slightly higher compared to last year’s results with respective quiz scores in order as: 96.2%, 93.8%, 98%, 97.1%, 98.4%, 95.9% and 95.5%.
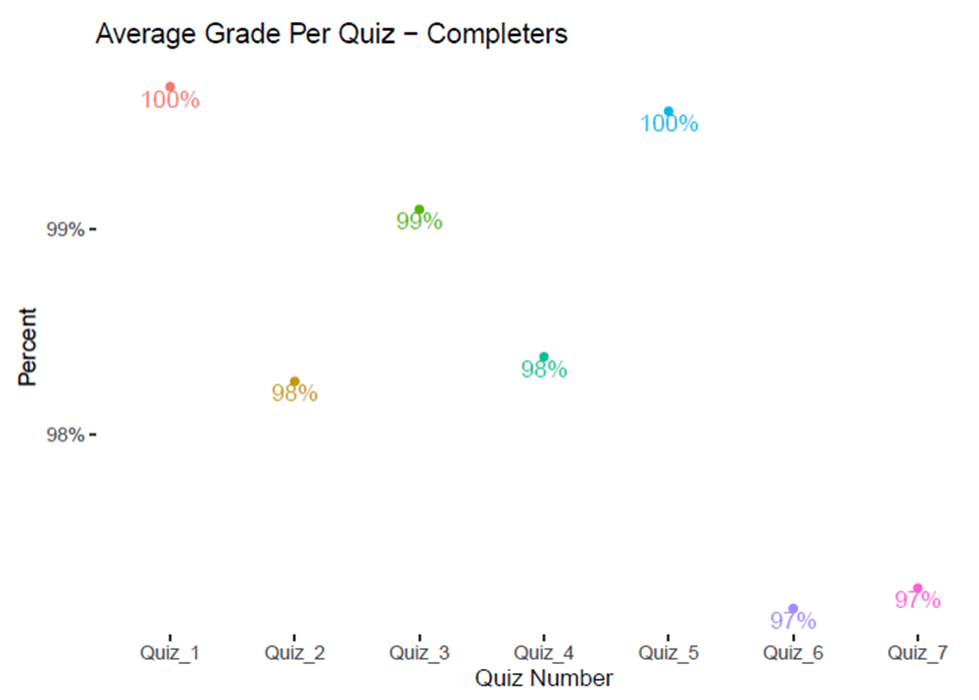
Completers quiz results are more positive than the overall quiz results. Again, the mode quiz scores were the max values (100% correct score) per respective quiz, so average quiz scores are shown below to offer a bit more variability with respect to student performance in each quiz. Even with the averages, each quiz average is 97% correct or higher. These average scores are relatively the same (some slightly higher, some slightly lower) compared to last year’s completer quiz data across the board for each quiz. Last year’s details compared to this year’s, respectively, include: Quiz 1 98.8%, Quiz 2 with 98%, Quiz 3 99.2%, Quiz 4 98.6%, Quiz 5 99.3%, Quiz 6 97.6% and Quiz 7 97.7%.
Data Disaggregation
Overall quiz results were disaggregated by completer demographics. As such, results are filtered from all course participants (1958) to those who completed the course (350). Then, the results are further filtered to remove course participants who did not consent to their data being used for reporting purposes, bringing the sample to 356. Finally, results per demographic question may vary in sample size due to consenting course completers who may not have answered specific demographic questions or taken the Welcome Survey at all (where demographic data is gathered) – a maximum possible sample size of 309 based on completers taking the Welcome Survey.
Across quiz scores and demographics, groups did fairly well overall (which makes sense considering all quiz scores averaged 96% or higher). Looking across a given demographic’s scores (i.e., across all groups within a given demographic), the most participants with overall quiz scores of 95% or higher was sex (66%) followed by assessment competency groups (61%).
Results around sex were 61% last year and competency groups were 58% last year, so the overall higher scores this year bore out among the demographics. This kind of disaggregation helps surface where there may be gaps, issues, or bright spots among and across specific populations. Future analyses could dig deeper than these descriptives to truly examine relationships between variables. See more information about the individual quiz question scores and demographic breakdowns in the Quiz Results 2024 part of the report.
Assignment Results
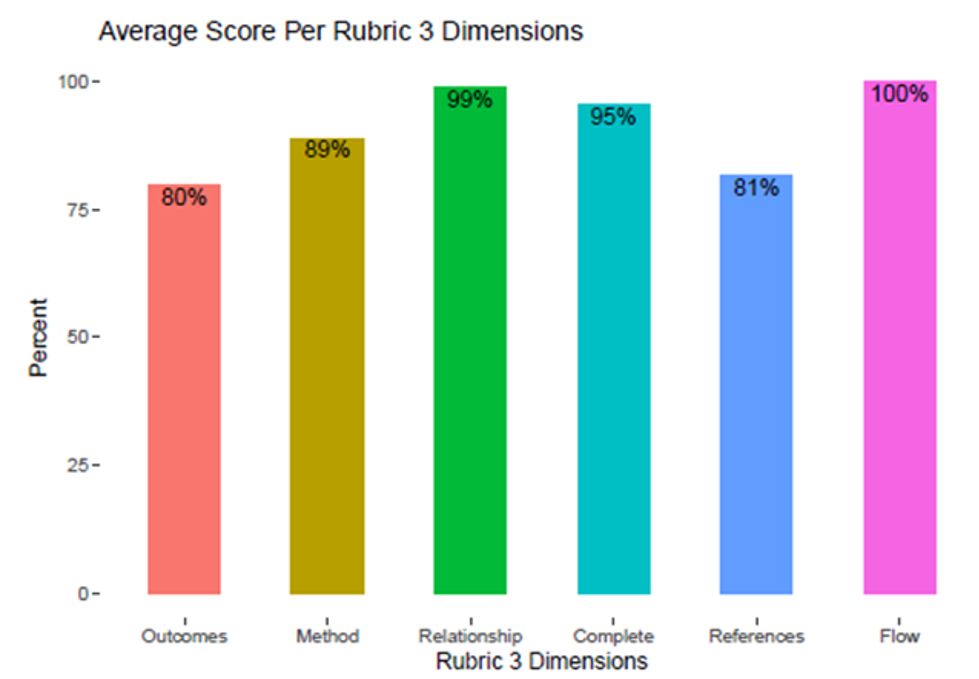
Overall, participants did pretty well on assignments. Participants needed a score of 75% or better on each assignment to count toward earning the course badge. The mode score for the Module 3 assignment was 28 out of 30 overall, with the following mode scores per rubric dimensions: Outcomes 5/5, Method 5/5, Relationship 5/5, Complete 5/5, References 5/5 and Flow 5/5. Last year, the overall mode score was 30, but the scores per rubric dimension results were the same. To add a bit more detail to the results, below are the average scores per rubric dimension presented as percent of 100% correct as scored.
The mode score for the Module 5 assignment was 25 out of 25 overall, with the following mode scores per rubric dimension: Connection 5/5, Critical lens 5/5, Complete 5/5, References 5/5 and Flow 5/5. Last year, the results were exactly the same. To add a bit more detail to the results, below are the average scores per rubric dimension presented as percent of 100% correct as scored.
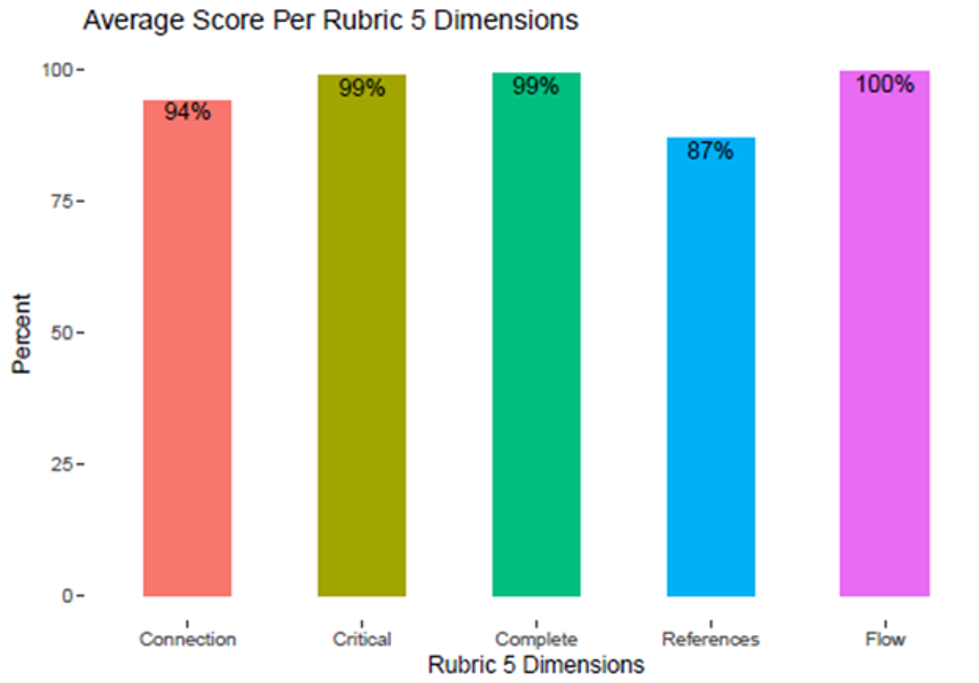
It is worth mentioning these data were not filtered for course completers; aside from people who did not want their data to be used for analysis purposes, these data reflect all submitted assignments by course participants. The next section of the report helps get into more detailed performance of participants per assignment rubric.
Data Disaggregation
In looking to analyze the results, responses were filtered for only participants who consented to using their data for assessment or report-related purposes. This resulted in a sample of 348 participant artifacts for the Module 3 assignment and 316 participant artifacts for the Module 5 assignment. It is worth noting these resulting samples of 348 and 316 differ from overall amounts of assignments graded (396 for module 3 and 360 for module 5) since not all participants consented to their data being used for reporting purposes. Moreover, these sample amounts differ from overall course completers (350) since successful course completion requires scoring 75% or better on each quiz and on each written assignment, which not all of these assignments may represent.
Across rubric scores and demographics, groups did fairly well overall (which makes sense considering the mode score for module 3 was 28/30 and module 5 was 25/25). Overall results were relatively similar to last year's data: three of the six rubric dimensions for Module 3 were the same or better compared to last year and four of five for Module 5 were the same or better. Across self-reported assessment competency, sex and gender populations, 67-77% of folks across groups earned an 87% or better on Module 3 and 67-84% of folks across groups earned a 92% or better on Module 5. Gender and Race and Ethnicity breakdowns were a bit less consistent, having a few group exceptions to those amounts. For more detail and data on the demographic disaggregation or the assignment performance data, check out the Rubric Results 2024 part of the report.
User Experience Survey/End of Course Evaluation Results
End of course evaluation occurs by way of a user experience survey offered to all participants. An initial sample of 344 respondents was filtered for only participants who consented to using their data for assessment or report-related purposes. For comparison purposes with other course data sets, respondents were further filtered by participants who successfully completed the course and earned the course badge. This resulted in a sample of 269 responses.
- 93% of respondents agreed or strongly agreed to positive impact of course materials (videos, lecture material, readings). These results are 3% points lower than last year.
- 92% of respondents agreed or strongly agreed to positive impact of course activities (quizzes, assignments, discussion boards). These results are 3% points lower than last year.
- 66% of respondents indicated they spent 2 hours or less on the course each week (down from 73% last year), with another 20% (86% total) spending 3-4 hours per week (down from 93% last year).
- 55% of respondents indicated likelihood to recommend a course as a 9 or 10 (down from 62% last year), with another 24% (69% total) responding with an 8 (down from 87% last year).
- 91% of respondents rated course quality as 4 or 5 out of 5 stars. This year's data is down from last year's result of 95% responding with 4 or 5 stars.
- 55% of respondents indicated instructor involvement should be a variety (down from 68% last year), while 30% indicated they like to learn on their own (up from 27% last year). Peer to peer learning increased to 8%, interacting only with instructor to 6% and no instructor interaction decreased to 1% (all were at 5% last year).
- 49% of respondents indicated a course length preference of 7-8 weeks (same as last year), 28% indicated a preference of 5-6 weeks (down from 30% last year).
Data Disaggregation
Given the disaggregated results shared, future analyses could dig deeper than these descriptives to truly examine relationships between variables. This would especially be worthwhile with respect to hours spent per week for Functional Area, Role, Assessment Competency, Non-Native English speakers and Gender—as these areas seemed to have general stability or decreases across group percentages for spending 4 hours or less per week on the course despite the overall data showing an increase in time spent on the course per week. Likewise, Online Learner Type, Role and Education Levels all showed stability or increases across group percentages of overall rating for the course despite overall data showing a decrease in overall rating for the course. To see more of these demographic results or survey results overall, check out the User Experience Survey Results 2024 part of the report.
Qualitative Analyses
When looking at the user experience survey, the majority of comments were positive, with multiple comments containing suggestions for improvement. Thinking through the suggestions for improvements, as well as the constructive feedback, the instructors will reflect on ways to address the following as possible course changes in 2025:
- Consider placement and content of the personal take/additional perspective videos.
- Include transcripts and handouts to support participant learning for diverse learner preferences.
- Balance readings and resources for currency, relevance and length for participant transparency.
- Make the course more engaging by incorporating discussions, activities and improving the video content.
- Review quiz materials to potentially make them more application-based or challenging for participants.
Impacting both quantitative and qualitative results are the more advanced folks in the profession or participants with more assessment experience. They indicate the course was not as challenging as they expected or that they wanted more than an overview on these assessment-related concepts. While their perspective is of value, we also know that – year in and year out – we know that the profile of course participants is approximately 50% self-described assessment beginners who spend 0-20% of their job doing assessment work. As such, we very much have to balance the feedback of the experienced folks calling for more detail, depth and advanced content. This is especially true when those assessment beginners or even folks new to this style course (asynchronous, online, MOOC) are already overwhelmed with format, structure and variety of information provided to them. There are far more folks in the beginner/overwhelmed state than the advanced and wanting more state, so we balance how much more depth and advanced content we offer. Given we already have plenty of optional and further learning content, though, we continue to intentionally think about what and how much new content we add to still engage and encourage more experienced folks to find meaningful ways to leverage the course experience.
Best of all for this upcoming year is that we have two new instructors due to others transitioning to new opportunities. With two-thirds of the instructor team being new, it will offer fresh perspectives and immediate opportunity to revamp video lectures, resources and content throughout the course. The instructor team is eager to use this information as direction, guidance and direct feedback for what is working well, what to improve and what participants are looking for with respect to experience in the course. The course instructors take these data very seriously and work to have the participant voice reflected in the many improvements and enhancements made to the course.
Thank You
We would be remiss if we did not express our gratitude for the co-sponsors of the 2024 course. Efforts this year were made possible due to the continued, generous partnership and support from Modern Campus. Anyone who wants the latest course information or stay abreast about the next course iteration should visit SAAL's open course webpage.
Conclusion
The course, at its core, always has been to serve as a resource to support professionals interested in learning more about assessment for student affairs and co-curricular areas. As such, while we enjoy a great completion rate for a MOOC, we are quick to encourage anyone and everyone to sign up for the course in order to gain (and retain) access to the course and its materials. We are pleased, too, the course continues to be a popular and positive experience for participants.
While we are always eager for people to spread the word and look to join the next course run (coming early 2025!), we care most that people are finding the course materials useful and it is helping improve their practice. It is great when we hear the success stories and ways in which the course has helped people. For all those stories we don’t hear back, we hope the course is helping move the needle and encouraging people to better engage their institution in the work and, most importantly, collaborate across campus to create the best environment for student learning. In today’s higher education environment, data-informed decision making for continuous quality improvement is everyone’s responsibility. We hope the course can continue to play even a minor role in assisting people in those efforts to best support student learning and success.

.
Last updated: July 26, 2024