Google Analytics for Higher Education: The 5 Metrics to Know
If you want your digital presence to stand out against the competition, it’s no longer
enough to have a beautiful website chock full of information—now you need to understand
the science behind your pages to better engage and ultimately attract prospective
students to your website.
Google Analytics is a free tool that allows higher education institutions to analyze website traffic to better understand who is visiting the website, how they are interacting with specific pages, and what information they are seeking.
This post answers several key questions regarding web analytics for higher education:
- Why is Google Analytics so important for higher education?
- How can I understand the data colleted in Google Analytics for my higher education institution?
- What are the top Google Analytics metrics for higher education?
Answers to these questions explain how web data is captured and analyzed so that colleges and universities can boost the performance of their digital marketing campaigns.
Why is Google Analytics so important for higher education?
You may think a web page is informative, a department head may think a web page is informative, but unless you have the data, there’s no way to tell how well the information you are sharing is reaching, engaging, and influencing your target audience.
Web analytics for higher education is essential to helping increase your college or university’s digital presence. Use Google Analytics to:
- Understand your audience. Who is visiting your website and what pages are they reading? Even more telling is
what visitors do after landing on a page within your website. Do they stay and read
the information on the page? Do they click through a link to another page? Or do they
immediately close the page and move to another website? Your website’s data provides
clues into how your audience interacts with your website. Using these clues, you can
tailor your content so that it better meets the needs of site visitors.
Your higher ed institution can learn a lot through Google Analytics when you know how to use its tools. - Measure the performance of your website. By creating a measurement plan, you can assess the performance of your website over
time. This helps you determine the best approach to track and tag data, reach goals,
and drive conversions. Data can also help you by highlighting what’s not working on
your website so that you can revise or delete content, restructure your navigation,
or implement new ways to connect with your audience—all in an attempt to keep your
audience engaged.
- Create data-driven reports to support your digital marketing campaigns. Asking for more money to support your digital marketing efforts is a lot easier if you have data to support your objectives. The data that is captured and measured with Google Analytics provides insights into how your audience digitally engages with your school.
How can I understand the data presented in Google Analytics for my higher education institution?
There are three ways that Google presents information so that you can understand engagement on your website:
Goals
Goals measure whether site visitors “convert”—or complete specific actions such as completing a form or using the financial aid calculator. Without this information, it’s impossible to evaluate the effectiveness of your online marketing campaign.
You can configure goals for specific pages or screens to determine how long visitors stay on your website and how many pages they view. Configuring goals within Google Analytics is the best way to measure audience engagement on your site.
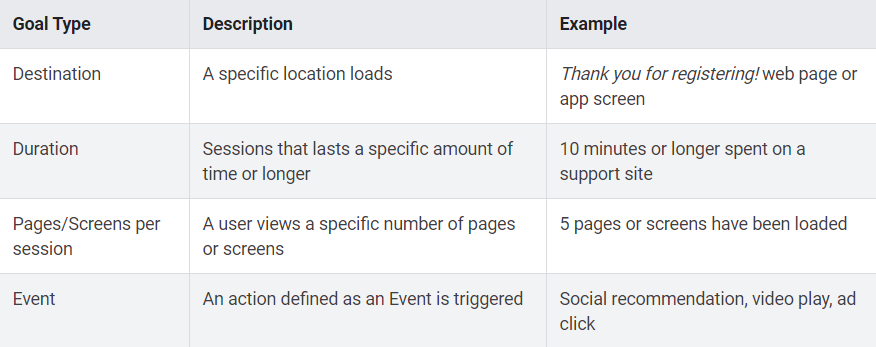
Google Analytics for higher education includes four types of goals: Destination, Duration, Pages/Screens per session, and Event.
Events
Events are actual site interactions. For example, if your website features a video of dorm living, you can track how many times visitors view the video by way of a link and/or a button. Use event tracking to determine whether visitors are viewing new content or completing various calls to action throughout your site.
Channel Overview
Channel Overview is a one-stop check-in of how your overall marketing strategy is performing. Each channel—email, social media, direct, referral, organic, etc.—is measured so that you know the percentage of traffic originating from each.
The Modern Campus CMS Site Analytics Gadget integrates seamlessly with Google Analytics. Get a demo to see it in action!
What are the top Google Analytics metrics for higher education?
Your Google Analytics dashboard will capture the following metrics for a select time period:
1. Audience Overview
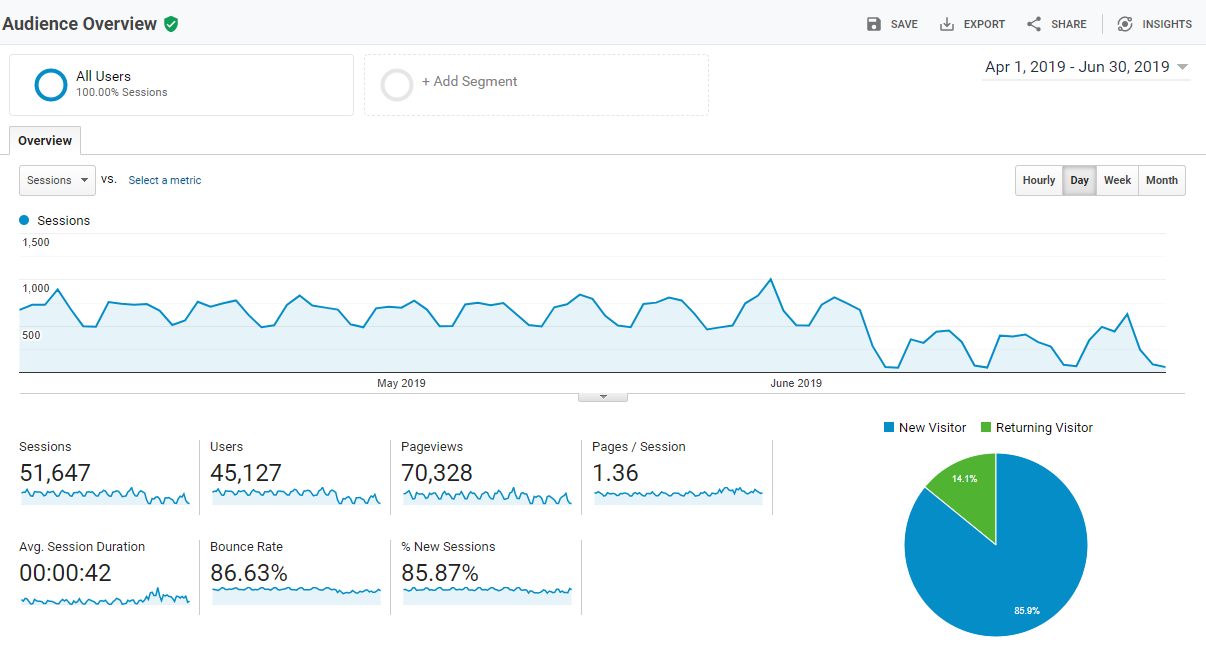
This feature captures data such as average session duration and number of pageviews that reveal traffic patterns on your website. By reviewing daily, you’ll understand typical site usage, but also identify atypical events as they occur. For example, if you see a spike in your overall site visits (sessions), check to see if your college or university is in the news, or if a social media post is performing particularly well.
2. Acquisition Overview
These metrics show you where your site visitors are coming from. This is a good way to see how well top channels such as paid search, display ads, or an email campaign are performing.
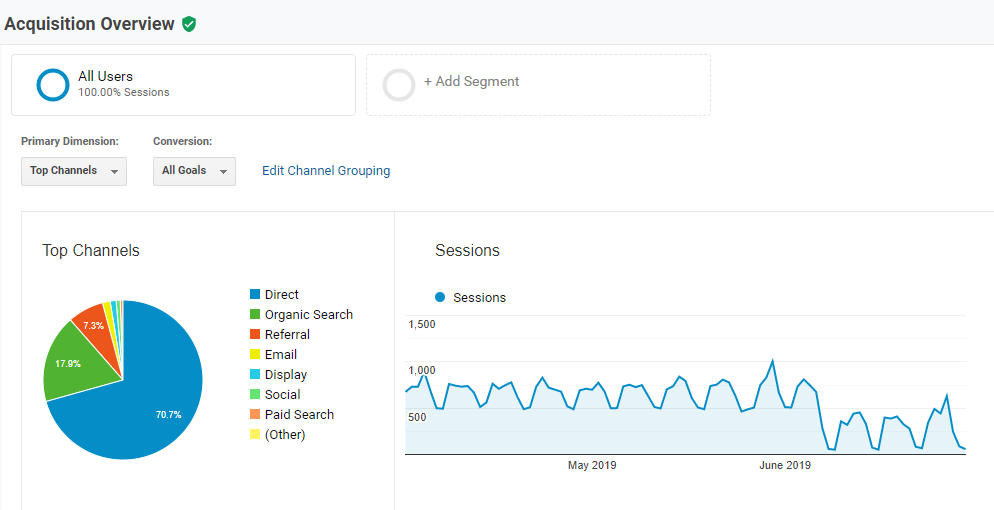
Understanding how to read the high-level overviews of different fields will allow your digital team to keep tabs on your site’s day-to-day performance as well as identify any unusual events or spikes.
3. Campaign Performance
Campaign tracking parameters must be set up in advance, but once you have them in place, you can see exactly how many clicks come from a specific source such as email or a social media channel, how many new users you gain, and even bounce rates from specific pages. Google has a Campaign URL Builder you can use to add campaign parameters to a page’s standard URL.
4. Goal Completions
This metric tells you how many users complete specific actions such as watching a video or submitting a request for information form. Like campaigns, goals need to be set up in advance. These web analytics can tell you overall goal completions, track conversions, and abandonment rates.
5. Event Performance
This feature tracks visitor interactions with your website. While goals are typically tied to conversions, events track simpler interactions such as scrolling down a page or clicking on a link. You can capture the total events on a specific page or use the data to find the average value of an event.
Conclusion
Google Analytics is an essential tool for measuring both short-term success and long-term website performance. If you’re a novice, use Google’s instructional content to learn more about the metrics. If you use a quality content management system such as Modern Campus CMS that integrates with Google Analytics, you can pull top site and page-level data directly into your CMS dashboard, making web analytics even easier to view and understand.
Build your knowledge by gaining a full understanding of one metric before moving on to another. Soon, you’ll have a powerful tool to help you make smart, informed decisions about web analytics for your higher education institution.
Ready to boost your college or university’s digital presence? Download College and University Website Redesign: The Ultimate Guide.
Last updated: February 5, 2021
