How Student Engagement Can Make or Break Your Retention Rate
Every student affairs professional knows that student engagement has a positive impact on a student’s sense of belonging, satisfaction with the institution and social confidence.
When students join campus clubs and orgs, attend campus (or virtual) programs and take advantage of other co-curricular opportunities, they feel a greater affinity toward their institutions and are more likely to stay enrolled.
But the positive correlation between retention and engagement is often “known” solely through anecdotal evidence. Staff who have a high level of daily interactions with students hear it all the time; students brag about the co-curricular skills they’ve learned, become more invested in institutional values and even develop greater enthusiasm for their classroom studies.
Yet, what about staff who don’t frequently interact with students nor have their fingers on the pulse of student life? That’s often the case with institutional leadership — including college presidents, chancellors and boards of trustees. These leaders don’t get to experience the connection between student engagement and success for themselves. In lieu of that, they understandably demand evidence that’s more quantifiable and irrefutable than anecdotes.
Institutional leadership needs proof in numbers to back up even the best anecdotes. Evidence is crucial to decisions regarding budget and resource allocations. In other words, without data, student affairs departments often struggle to secure the resources they need to continue — or better yet, improve upon — engaging students. And thus, retention rates aren’t as high as they could be and the entire institution is worse off for it.
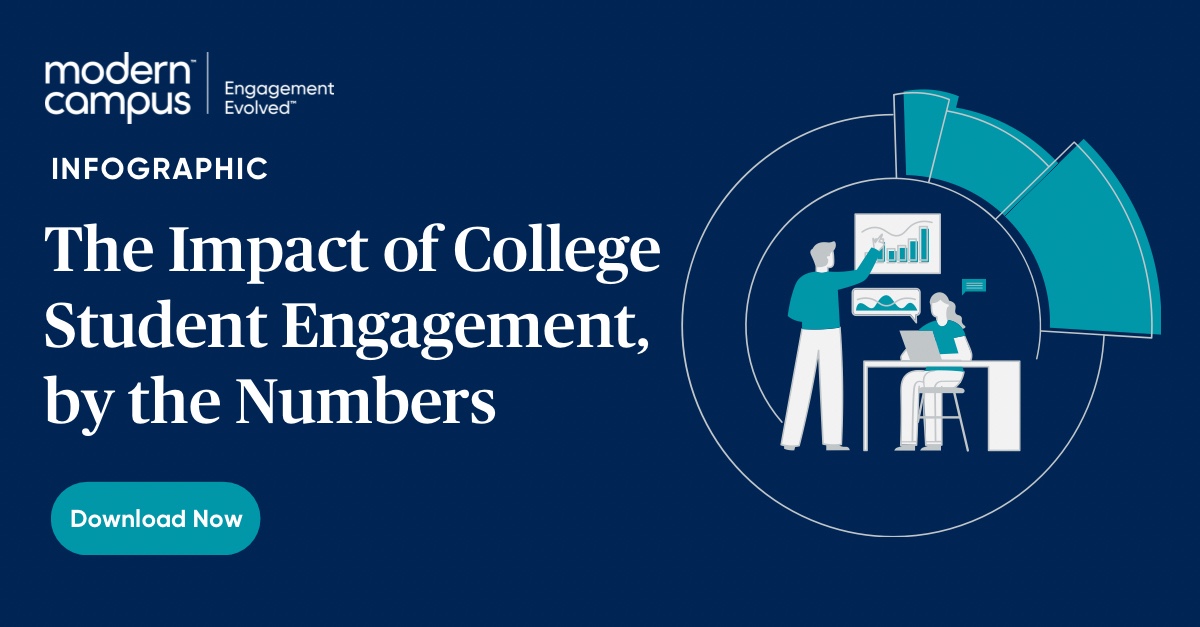
If your institution is lacking in data, don’t fret! In our newest infographic, we’ve assembled top statistics from researchers and institutions around the United States that showcase the quantifiable impacts of student affairs. Before obtaining your own institution-specific data, you can use these statistics as jumping-off points for helping decision-makers understand the enormous value of engagement.
What are the top findings connecting engagement to student success?
Retention & Persistence
- Harford Community College students who attend campus co-curricular events are 53.7% more likely to persist through to the next academic year than their non-engaged peers.
- First-year Arkansas Tech University students who record at least one hour of community or volunteer service have a 94% retention rate — 22% points more than their peers who didn’t record any community or volunteer service hours.
- Valdosta State University students who attend at least 10 events per semester are 13 percentage points more likely to persist through to the next semester.
Sense of Belonging
Compared to undergraduate students who were not involved, Ohio State undergrads who are highly involved with campus activities are:
- 2.6 times more likely to feel they were a part of the Ohio State community
- 2.4 times more likely to participate in Ohio State traditions
- 1.9 times more likely to be satisfied with their experiences at Ohio State
GPA
The average GPA of Purdue University students who are active members of at least one
student club or organization is .11 points higher than non-members. Additionally, student club and organization officers average a GPA of .22 higher
than non-members.
Career Prospects
At the Ohio State University, students who are highly involved in campus life are:
- 2.1 times more likely to be satisfied with their overall experience at the institution
- 1.8 times more likely to have a job offer at the time of graduation
- 1.7 times more likely to express interest in attending graduate or professional school
- Rated as 18% more career-ready by employers
…than their uninvolved peers.
Ready to unlock compelling data for your own institution? Assess student behavior in real time, analyze participation semester over semester, and gain the full picture of student engagement. It’s easy and rewarding with Modern Campus Involve. Book a demo with us to learn how it works.
Last updated: October 18, 2022


